Cell types TE enrichments
Sorted by mean value
TE SubFamilies Contribution
Specific TE SubFamily
Sorted by mean value
Data table
Data table
Transposable Elements Mean Overlap
Only one TE was recorded per peak
Transposable Elements enrichment overview
Transposable Elements Mean enrichment Per Mark
Specific TE Subfamily Overview
Only assays and TEs included within the page query are available to select.
Cell Type TE Subfamily Overview
Only assays and cell types included within the page query are available to select.
Up to top 40 most enriched TE subfamilies displayed
Import File
File List
Overlap Overview
TE overlap of uploaded sample(s) peaks compared to EpiATLAS and random data
Metric
Enrichments (Observed - Expected, fold change) are calculated relative to the Random overlap observed within EpiATLAS' corresponding dataset (selected cell type and histone)
Highlight
TE Enrichment Overview Heatmap
TE Family Enrichment
TE subfamilies Enrichment
Up to top 40 most enriched TE subfamilies displayed
Data table
About
TEExplorer
Version 0.989
2-2026
Methods
EpiATLAS TE measurements
EpiATLAS histone peak files (hg38) had their peaks resized to 200bp and then were overlapped with TEs from repeatmasker. For each subfamily the number of overlap was tallied for the count overlap metric. Only one TE was counted per peak. If more than one TE overlapped the peak, only the one with largest overlap was recorded. For each sample, an associated simulated random sample was generated. These samples were generated such that they matched the peak distribution of distances to TSS.
Enrichment calculations
The enrichments, observed-expected and fold change are calculated from the observed count, relative to the count obseved in the random samples. Thus, observed count - expected count and observed count / expected count respectively.
Understanding Enrichments (Include depleted)
For every sample, each TE subfamily overlap count was measured along with simulated random controls, the count was compared to the random count for each iteration. the Expected count is the mean of 1000 simulation. In addition, we deemed a TE significantly enriched if its count was higher than random 995/1000 times. By default (In TE subfamilies tab), only significant TEs are used. Inherently, the expected count are always lower and thus obs-exp is always positive. Include depleted ignores the significance of the measurement and enables observing depleted TEs.
Uploaded samples comparisons
Uploaded samples are taken as is and overlapped to the TEs from repeatmasker (hg38). Enrichments are calculated relative to the expected counts from average counts of the 5 iterations of random samples generation. For uploaded samples, if more than one TE overlaps a peak, the first one is kept. P-values are calculated from Fisher Exact Test comparing the Observed Count to the Expected counts from the random samples out of the total peak count. The test is single sided, with alternative hypothesis being lesser. The p-value is then adjusted with Benjamini & Hochberg.
In boxplot, stars are the significance of Wilcoxon test comparison between the groups. **** = pval< 1e-04; *** = pval<0.001; ** = pval<0.01; * = pval<0.05
Age estimation
The age estimates of each TE were calculated from the sequence divergence (milliDiv value from RepeatMasker). We divided the milliDiv value of each TE by 1000 and then by 2.2x10⁻⁹, the substitution rate of the human genome to calculate the age estimate.
Cite as:
Hyacinthe, J., Lougheed, D. R. & Bourque, G. TEExplorer: A Web Portal to Investigate TE-Epigenome Associations Across Human Cell Types. 2026.02.18.706470 Preprint at https://doi.org/10.64898/2026.02.18.706470 (2026).
Dataset based on IHEC’s EpiATLAS data and TE measurements from Hyacinthe et al. 2024
Hyacinthe, J. & Bourque, G. Transposable elements impact the regulatory landscape through cell type specific epigenomic associations. 2024.08.07.606967 Preprint at https://doi.org/10.1101/2024.08.07.606967 (2024).
EPiAtlas Data: https://ihec-epigenomes.org/epiatlas/data/
IHEC: https://epigenomesportal.ca/ihec/
TE annotations based on repeatmasker
Tool by Jeffrey Hyacinthe & David Lougheed
Bourque Lab 2026
Interactive heatmaps: Zuguang Gu, et al., Make Interactive Complex Heatmaps in R, 2021, Bioinformatics, https://doi.org/10.1093/bioinformatics/btab806
Change log
- 0.989 (6-2026): Added Explore by Cell type and Subfamily plots, Bed Export and UCSC genome browser export.
- 0.987 (2-2026): Minor issue fixes, preprint submission
- 0.985 (10-2025): Minor issue fixes
- 0.980 (05-2025): Minor issue fixes, import demo file, legend order match
- 0.950 (03-2025): Minor issue fixes, Auto load default result pages, caching
- 0.900 (09-2024): First public release
methods
EpiATLAS TE measurements
EpiATLAS histone peak files (hg38) had their peaks resized to 200bp and then were overlapped with TEs from repeatmasker. For each subfamily the number of overlap was tallied for the count overlap metric. Only one TE was counted per peak. If more than one TE overlapped the peak, only the one with largest overlap was recorded. For each sample, an associated simulated random sample was generated. These samples were generated such that they matched the peak distribution of distances to TSS.
Enrichment calculations
The enrichments, observed-expected and fold change are calculated from the observed count, relative to the count obseved in the random samples. Thus, observed count - expected count and observed count / expected count respectively.
Understanding Enrichments (Include depleted)
For every sample, each TE subfamily overlap count was measured along with simulated random controls, the count was compared to the random count for each iteration. the Expected count is the mean of 1000 simulation. In addition, we deemed a TE significantly enriched if its count was higher than random 995/1000 times. By default (In TE subfamilies tab), only significant TEs are used. Inherently, the expected count are always lower and thus obs-exp is always positive. Include depleted ignores the significance of the measurement and enables observing depleted TEs.
Uploaded samples comparisons
Uploaded samples are taken as is and overlapped to the TEs from repeatmasker (hg38). Enrichments are calculated relative to the expected counts from average counts of the 5 iterations of random samples generation. For uploaded samples, if more than one TE overlaps a peak, the first one is kept.
P-values are calculated from Fisher Exact Test comparing the Observed Count to the Expected counts from the random samples out of the total peak count. The test is single sided, with alternative hypothesis being lesser. The p-value is then adjusted with Benjamini & Hochberg.
In boxplot, stars are the significance of Wilcoxon test comparison **** = pval< 1e-04; *** = pval<0.001; ** = pval<0.01; * = pval<0.05
Cite as:
Hyacinthe, J., Lougheed, D. R. & Bourque, G. TEExplorer: A Web Portal to Investigate TE-Epigenome Associations Across Human Cell Types. 2026.02.18.706470 Preprint at https://doi.org/10.64898/2026.02.18.706470 (2026).
Dataset based on IHEC's EpiATLAS data and TE measurements from Hyacinthe et al. 2024
Hyacinthe, J. & Bourque, G. Transposable elements impact the regulatory landscape through cell type specific epigenomic associations. 2024.08.07.606967 Preprint at https://doi.org/10.1101/2024.08.07.606967 (2024).
EPiAtlas Data: https://ihec-epigenomes.org/epiatlas/data/
IHEC: https://epigenomesportal.ca/ihec/
TE annotations based on repeatmasker
Tool by Jeffrey Hyacinthe
Bourque Lab 2026
Interactive heatmaps: Zuguang Gu, et al., Make Interactive Complex Heatmaps in R, 2021, Bioinformatics, https://doi.org/10.1093/bioinformatics/btab806
Change log
0.989 (6-2026): Added Explore by Cell type and Subfamily plots, Bed Export and UCSC genome browser export.
0.987 (2-2026): Minor issue fixes, preprint submission
0.985 (10-2025): Minor issue fixes
0.980 (05-2025): Minor issue fixes, import demo file, legend order match
0.950 (03-2025): Minor issue fixes, Auto load default result pages, caching
0.900 (09-2024): First public release
TEExplorer
Currently Updating Webpage, Tool not stable. Usage not recommended.
TEExplorer is a Transposable Element (TE) portal that simplifies TE and repeat consideration by providing an atlas of TE enrichment within the human epigenome that can be explored through specific queries. The Atlas cover 6 histone marks, over 40 human cell types from the IHEC EpiATLAS dataset. In addition the portal allows the analysis of TE overlap within user uploaded Bed files and straightforward comparison with the atlas' data.
TE Overview
Overview of TE family enrichment across human cell types and histone marks. Select TE, Histone and Cell types of interest for more specific inquiry.
TE Subfamilies
Investigate the subfamilies of a specific TE family and their overlap or enrichment within a histone across cell types
Import
Upload your own hg38 bed file to and obtain the TE overlap, TE enrichment visualization and compare your data with the EpiATLAS dataset
Explore TEs
Explore TE enrichment within a cell type
Or Explore by TE subfamily
TEExplorer
TEExplorer is a TE portal that simplifies TE consideration by providing an atlas of TE enrichment within the epigenome that can be explored through specific queries. The Atlas cover 6 histone marks, over 40 cell types from the IHEC EpiATLAS dataset. In addition the portal allows the analysis of TE overlap within user uploaded Bed files and straightforward comparison with the atlas' data.
Guides
TE Overview
Displays an overview of TE family enrichement across cell types and histone marks. Select TE, Histone and Cell types of interest for more specific inquiry.
- Can go from a broad overview to a specific TE family and cell type query
Overview Input

- TE Families: Select the TE families to display
- It is thus possible to focus on specific TE families if desired.
- By default only Major families are selected. (Major families)
- The select All button will automatically select all families.
- Histone: Select the histones to display
- Cell categories: Select the cell types to use
- Press run to display the TEs coverage and enrichments found within the samples fitting the input selection
TE histone coverage

- In the coverage overview we show the TE coverage of chosen histone marks for samples within the selected cell types.
- The TE histone coverages are colored by TE family.
- The TE coverage represents the mean percentage of peaks that overlapped TEs of given families.
Overview heatmap coverage

-
In the coverage overview we show the TE coverage of chosen histone marks for samples within the selected cell types.
-
The TE histone coverages are colored by TE family.
-
The TE coverage represents the mean percentage of peaks that overlapped TEs of given families.
-
The TE enrichment overview heatmap displays the EPIATLAS samples
- X axis are TE subfamilies grouped by family as annotated on top
- With the Top Subfamily toggle, you can display additional less enriched subfamilies (shows all subfamilies)
- X axis are TE subfamilies grouped by family as annotated on top
-
Y axis are the samples matching the selected assay and cell type.
-
They are labeled by color is the associated cell type, and grouped by assay
Overview Family enrichment

- TE family enrichment provides an overview of the family level Mean enrichment (obs-exp) across the samples
- For instance these samples were depleted in Alu and L1 and slightly enriched in MIR
TE Subfamilies
The Subfamily Tab allows the investigation of TE subfamilies enrichments within a select TE family across cell types.
- Can discern in which cell types TEs are enriched and which specific TE subfamilies specifically are enriched
TE subfamilies Input

- Metric: select which metric to display between
- Obs-Exp: the default metric, Observed overlap percentage from which the expected overlap percentage (from simulations) is substracted
- Observed: the observed peak overlap counts
- Fold change: the default metric, Observed overlap percentage divided by the expected overlap percentage (from simulations)
- The Assay: Select a histone mark
- TE family: Select the TE family to investigate
- Include Depleted: When False (default), Only use significantly enriched TE subfamilies within the data. Thus, all enrichments will be positive because observed is in those cases larger than expected by definition. If toggled on, Non significantly enriched TE subfamilies will be used, allowing negative enrichments to be shown.
TE family metrics

- When the analysis is run, some TE family metrics are displayed
- TE family Name
- The mean mappability according to 50bp Mappability track from the UCSC genome browser
- The Instance count according to repeatmasker
- And the TE subfamily count according to repeatmasker
Cell type TE Enrichment

- An interactive boxplot of the enrichment (or select metric) of the selected TE family within the selected assay across all cell types.
- Sorted by mean enrichment (or select metric)
- Interactivity:
- You can focus on specific areas of the plot
- Double clicking cell types from the legend will only display the cell type
- Single clicking a cell type will toggle its visibility
TE subfamilies contributions heatmap

-
Heatmap of the TE subfamilies enrichment (chosen metric)
-
X axis are the TE subfamilies
-
Y axis are the cell types
-
hovering a tile will display additional info
- gray are N/A often caused by there being no significant enrichment (when show depleted toggled off)
-
You can select the number of subfamilies to display. (Priority by mean enrichment)
TE subfamilies contributions boxplot

- An interactive boxplot of the enrichment (or select metric) of the selected TE family within the selected assay across the TE subfamilies and all cell types.
- Sorted by mean enrichment (or select metric)
- This plot is best used by zooming in to distinguish cell types
- Interactivity:
- You can focus on specific areas of the plot
- Double clicking cell types from the legend will only display the cell type
- Single clicking a cell type will toggle its visibility
TE subfamilies Data

- Finally a table of the data.
- It contains the overlap count of the samples matching the input query for each TE subfamily as well as the expected counts from the random simulation and resulting enrichments.
- The Table can be downloaded
Import
Import file

- Browse for Interval bed files (HG38) which you would like to obtain the TE contents of.
- Select the assay and cell type to serve as baseline
- Usually, the same or most similar to your data. *Top subfamilies restricts to the most enriched subfamilies, It is faster *Resize will resize the peaks to 200bp, the same size as the EpiATLAS data. It makes comparisons to the baseline data more equivalent.
- Press Run to launch the analysis.
File List

- Once the analysis is over, a file list will appear.
- From it you can Assign a groups to samples if they belong to different testing variables.
- For instance NI (Not infected) was assigned to a different group than Flu.
- These grouping will separate the samples in some plots and analysis.
Quality control

- The Imported data QC helps observe the quality of the uploaded data through its similarity to the EpiATLAS data.
- The uploaded samples (green diamonds) should ideally cluster with the right Assay.
- They should also ideally group with the right cell type, but cell type clusters are much less clearly defined
Coverage Overview

- In the coverage overview we first present the Random simulation* TE coverage and the coverage from the EpiATLAS samples fitting the selected TE and Cell type.
- Then we show the TE coverage of peaks in the uploaded samples.
- They can thus be easily compared to Random and EpiATLAS coverages.
Metric

- The following plots can display multiple metrics.
- By default, Observed-Expected (in percentage) is used. Fold change (observed/expected) or Observed count can be use.
- Note that “expected” counts used for enrichment are taken from the “Random” coverages. The random coverages were pre-calculated and pre-generated for the EpiATLAS data.
- More…
Highlight


- In highlights we show the most extreme enrichments across all TEs and uploaded samples. (most enriched and least enriched)
- This can be useful to know which TEs might stand out
- For instance, G-Rich and MIR3 TEs seems to be more enriched in the uploaded samples
- We also show the TE enrichments most distinct between the uploaded data and EpiATLAS data.
- Black points are EpiATLAS value
- This can be useful to know which TEs particularly stand out compared to other data.
- For Instance, AluY is a bit more enriched (~-0.5%) in the uploaded samples than within the EpiATLAS samples where they were even more depleted (~-1%)
Enrichment Heatmap

- The TE enrichment overview heatmap displays the EPIATLAS samples at the top and uploaded samples grouped at the bottom.
- X axis are TE subfamilies grouped by family as annotated on top
- Y axis are the samples, the top one are from EPIATLAS while the named ones at the bottoms are the uploaded one.
- The EPIATLAS samples shown are only those matching the selected assay and cell type.
- In the case where multiple cell types or assays are chosen, they will be labeled by color, and grouped by assay
Family Enrichment

- TE family enrichment provides an overview for each uploaded sample of the mean enrichment (or overlap count) of TE families
- For instance these samples were depleted in Alu and L1 and slightly enriched in MIR
TE subfamily Enrichment

- The TE subfamilies enrichment section allows digging into specific TE families for specific subfamilies.
- Assay options are only available if “All” Assay was selected. The following plots will only use the selected assay
Boxplot

- Boxplot of the subfamilies TE enrichment (or chosen metric)
- EpiATLAS data will always be compared to the uploaded data. If the uploaded data was grouped, the groups will form distinct boxplots.
- Each point represent the enrichment of the subfamily within a sample.
- Hovering a point will provide additional details.
- For each subfamily, a statistical test is performed between the groups.
- Up to 40 subfamilies can be displayed
Heatmap

- Heatmap of the TE subfamilies enrichment (chosen metric)
- X axis are the TE subfamilies
- Y axis are the samples, at the Top are EpiATLAS samples, at Bottom are the uploaded samples
- hovering a tile will display additional info
- Up to 40 subfamilies can be displayed
Data Table
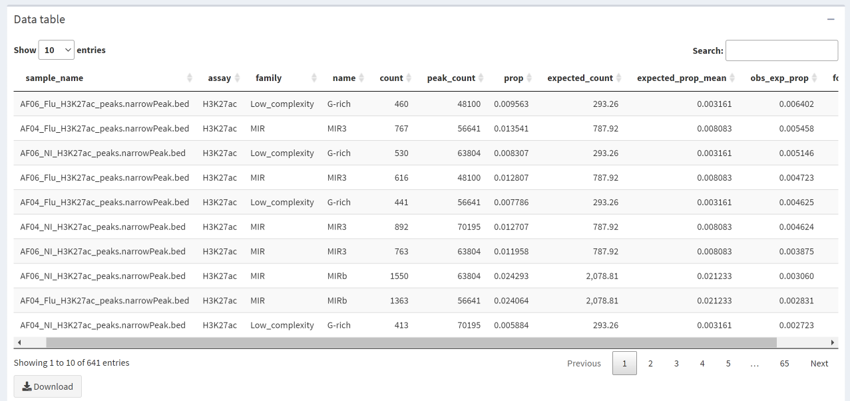
- Finally a table of the data from uploaded samples is available.
- It contains the overlap count of the uploaded samples for each TE subfamily as well as the expected counts from the random simulation and resulting enrichments.
- The Table can be downloaded